(Blog.com.np/SIROMANI DHUNGANA): The dominant narrative promoted by a section of ethno-centric activists and intellectuals is that Nepali civil service is dominated by Hill Bahun/Kshetri and that the Madhesis are excluded and underrepresented.
This is the mixture of lies and half truth. A comprehensive research considering caste, ethnic and gender dimensions of Nepali society shows a different picture. The Nepal Social Inclusion Survey 2012 (NSIS) ranks different caste groups of Nepal on the basis of their representation in government services in proportion to the size of their population [Added on 21st December for clarity: the research states, “on the basis of percent of households with access to government jobs”.
Three high-caste Madhesi groups are at the top of this list.
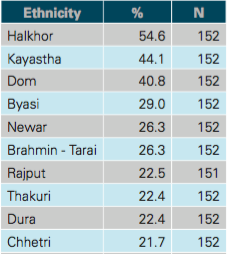
Population groups by access to government jobs. Madhesi groups are ranked higher than others:

Related: The findings of the report were also published in Nepali in Setopati.निजामती सेवामा सबैभन्दा बढी प्रतिनिधित्व राजपूत, कायस्थ र तराई ब्राम्हण]
The study reveals that some Madhesi communities: Rajput, Kayastha and Tarai Bahun have more representation in Government jobs than their share of population and are among the top seven most represented population groups of Nepal. Among the top seven ethnic communities, only two are Hill (Pahadi) communities. The remaining are Madhesi groups.
“The Madhesi B/C [Bahun/Kshetri] has the highest percentage (29.1%) in government jobs, which is followed by the Newar (26.3%), Hill Chhetri (21.5%) and Hill Brahmin (15.8%).” The findings of the multidimensional study state, “Dalits, including Madhesi and other caste groups, are well below the average.”
The study very specifically points out that Halkhor and Dom, two other Madhesi groups (ranked at positions 1 and 3), are mostly involved in public services of a low level (cleaning jobs). This suggests that other groups at the top level, including the Madhesi groups like Kayastha, Terai Brahmin, and Rajput do not share such characteristic.
It is important to remember that Madhesi (representing 20% of Nepal’s population) is not a single homogeneous population group. There are huge disparities within different Madhesi communities and their levels of progress. Several Madhesi groups (like Dalits) are among the most backward and disadvantaged in Nepal. At the same time, several other Madhesi groups (like Madhesi Brahmins, Kayasthas, Rajputs) are ahead of all other ethnic groups in Nepal in terms of Human Development Index (HDI), education, wealth, access to government services and opportunities.
[Related: Debunking Dr. Karan Sinsh’s misinformed comments on Nepal in the Indian Parliament]
 The study reports that Hill Dalits, which is a broad group, are in the lowest position and Muslims only slightly above them.
NSIS shows that there is no domination of a single caste in Nepali civil service. Out of 98 individual caste groups covered by the survey, 20 castes have more representation in civil service than their shares of population.
According to the study, “Government jobs” covers employment by the government at both the national and local levels, according to the survey. “At the local level, it covers jobs in VDCs, municipalities, DDCs and other government line agencies. However, the level of job is not specified, therefore, including all levels from sweepers to officers.”
It is important to understand whether there is inclusion in government employment, because it is one of the pertinent institutions for governance, the survey states. The study was carried out by Central Department of Sociology/Anthropology of Tribhuvan University and published in March 2014. It was funded by the Royal Norwegian Embassy (RNE) in Nepal through Social Inclusion Research Fund (SIRF)/SNV. The list of people who led the study can be seen in the picture below.

Note (Added 21st Dec 2015):
The study cited in this post is based on the number of households having access to government jobs. Our initial post missed this detail. All questions regarding the study and methodology should be directed to the concerned research teams. For more clarity, we are adding some statistics of some ethnic groups below.
According to the Population Census of Nepal 2011, average household sizes for some ethnic groups are:
Kayastha 5,1, Madhesi Brahman 5.1, Rajput 4.1, Thakuri 4.9, Newar 4.5, Chhetree 4.7, Hill Brahmin 4.2.
The Human Development Index (HDI) values (published by UNDP) for some ethnic groups are: Hill Brahman 0.557, Hill Chhetri 0.507, Madhesi Brahman/Chhetri (includes Rajput and Kayastha) 0.536, Madhesi Other Castes 0.460, Newar 0.565.
The chart is included below for reference.
